Full citation: Chaos, Solitons and Fractals: the interdisciplinary journal of Nonlinear Science, and Nonequilibrium and Complex Phenomena (2013), pp. 194-201 DOI information: 10.1016/j.chaos.2013.08.00
In the paper I refer to my Netlogo model, which simulates the peloton as it oscillates between two primary phases: a low power output phase, and a high power output phase. I show how the peloton changes its pattern formations as a result of these collective power output changes.
After submitting that paper, I made a few tweaks to my model. The changes were small but resulted in increased realism. Also, instead of simply using what I call the "peloton convergence ratio (PCR)" as the main tunable parameter, I use other parameters which are incorporated into an actual equation that produces the PCR. Also, I included a new graph to show positional changes, which is an important indicator of the phase boundaries. Here a "phase" is simply a distinctive collective pattern formation. As cyclists know, peloton pattern formations are constantly changing, and hence "phase changes" and "transitions" between phases.
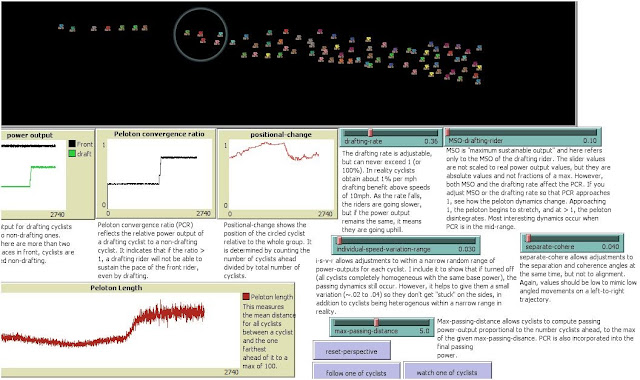
To illustrate, look at image A, below. I've set the drafting range and maximal sustainable output ("MSO") parameters (two blue sliders immediately below the black "road") such that when they combine (i.e operate according to an equation) they produce a certain Peloton Convergence Ratio, or PCR, (second graph from the left). In this case the PCR is comparatively low.
Note that the graph on the left shows the power output of a front rider (black line), while the green line shows the power output of the drafting rider.
At this comparatively low PCR, the positional change is high, meaning the riders rotate positions frequently. This is realistic because the drafting rate is high and drafting riders are well "rested" for passing those in front. This would characterize a high density phase, low PCR phase.
A.
However, in image B, below, I lowered the drafting rate. This has the effect of bringing the power output of the following rider closer to that of the front rider, and hence PCR increases toward 1 (see the steps on the green line for the power output of the drafting rider, and the corresponding step up in PCR). Notice how the peloton begins to stretch (also see the red line on the graph "Peloton Length"), and see the corresponding drop in positional change. The decrease in positional change means it is getting more difficult to pass.
B.
In image C below, I dropped the drafting rate a bit more. As noted, this brings the power output of the drafting rider closer to the output of the front rider, and increases PCR. Notice how the positional change dropped at one point dramatically, and then began to fluctuate. Here, because the world "wraps" around in a cylinder, as the peloton stretches, riders get "lapped" fairly quickly. This is largely why we see the significant jumps in the positional change values, although in the appropriate PCR range we also see self-organized oscillations, where stretching and low positional change occurs for certain periods, followed by increased density and higher positional change, and so the cycle continues for unpredictable durations.
C
So, this summarizes the result of my paper, although these recent tweaks connect the simulation even more clearly to the actual physical parameters we see in pelotons: drafting rate, power output of drafting rider relative to front rider, and riders' maximal sustainable outputs. These recent tweaks confirm the results of the published paper.
My plan at this point is to gather some data from video footage I took of some mass-start events at the Provincial Track championships, and to demonstrate how rates of positional change show phase boundaries.
Of course I would also like to show how these principles apply to other natural biological systems. The logical next place for me to look for this is American coot formations, since I have already seen and documented similar formations. The underlying mechanism for coot formations remains a hypothesis only, but this simulation itself should have, I think, applications in many different systems.


No comments:
Post a Comment